Manual: 7.1.5. Judging Model Goodness of Fit
The model should reproduce the training data very well. The real test of model goodness is on data that is not used to train the model. That is why the dataset that you specify by giving training time periods is automatically divided into training and validation datasets.
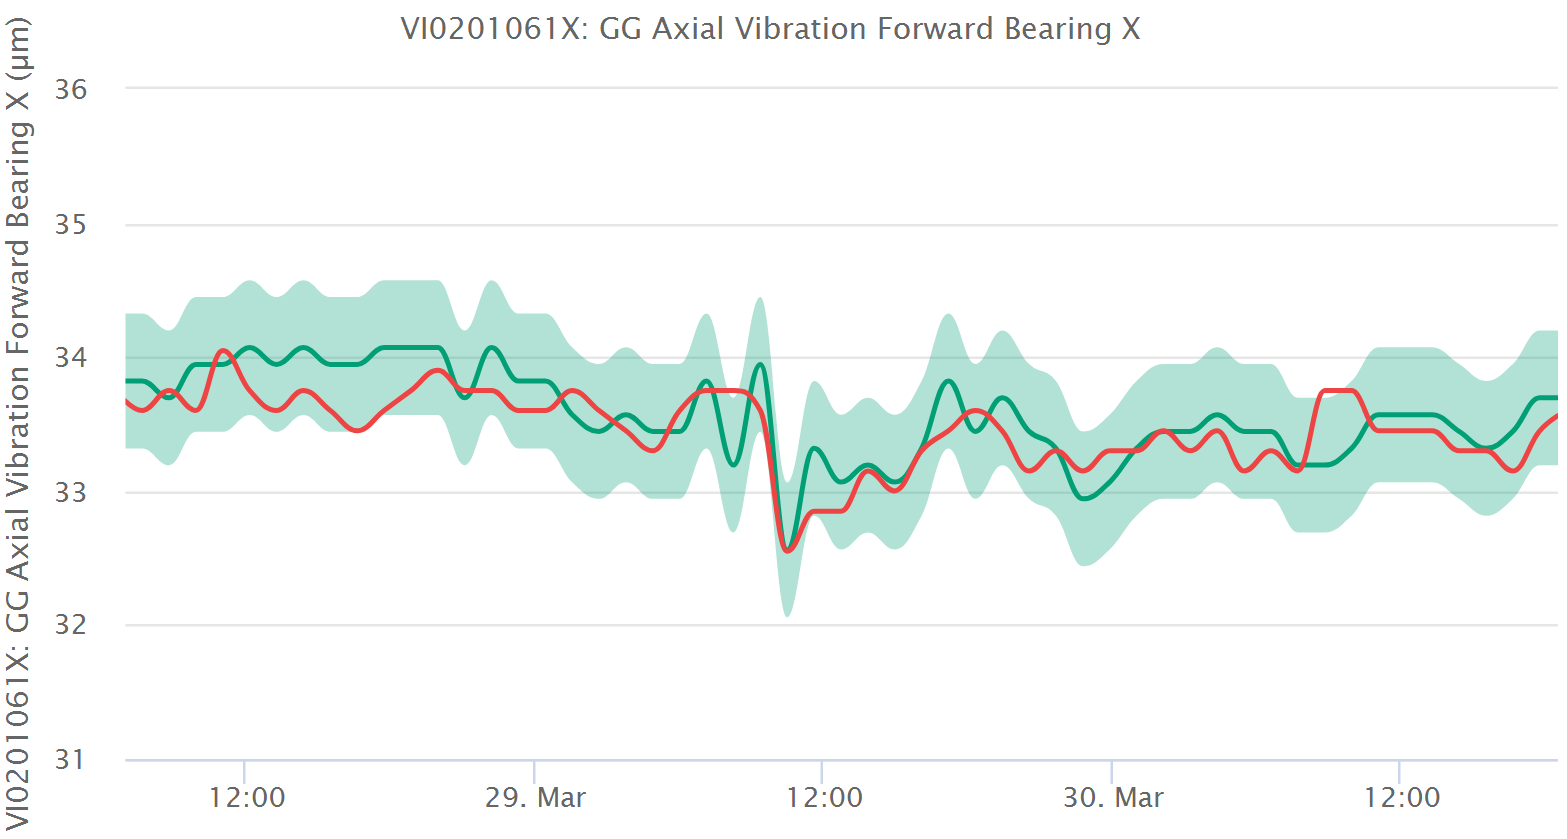
After training, the model is assessed automatically for its goodness and this can be seen in the interface in several different ways. The most direct way is the historical plot of model and measurement in which you can see the time evolution of both the model and the measurement. If they are close during healthy times and far during unhealthy times, the model is doing its job.
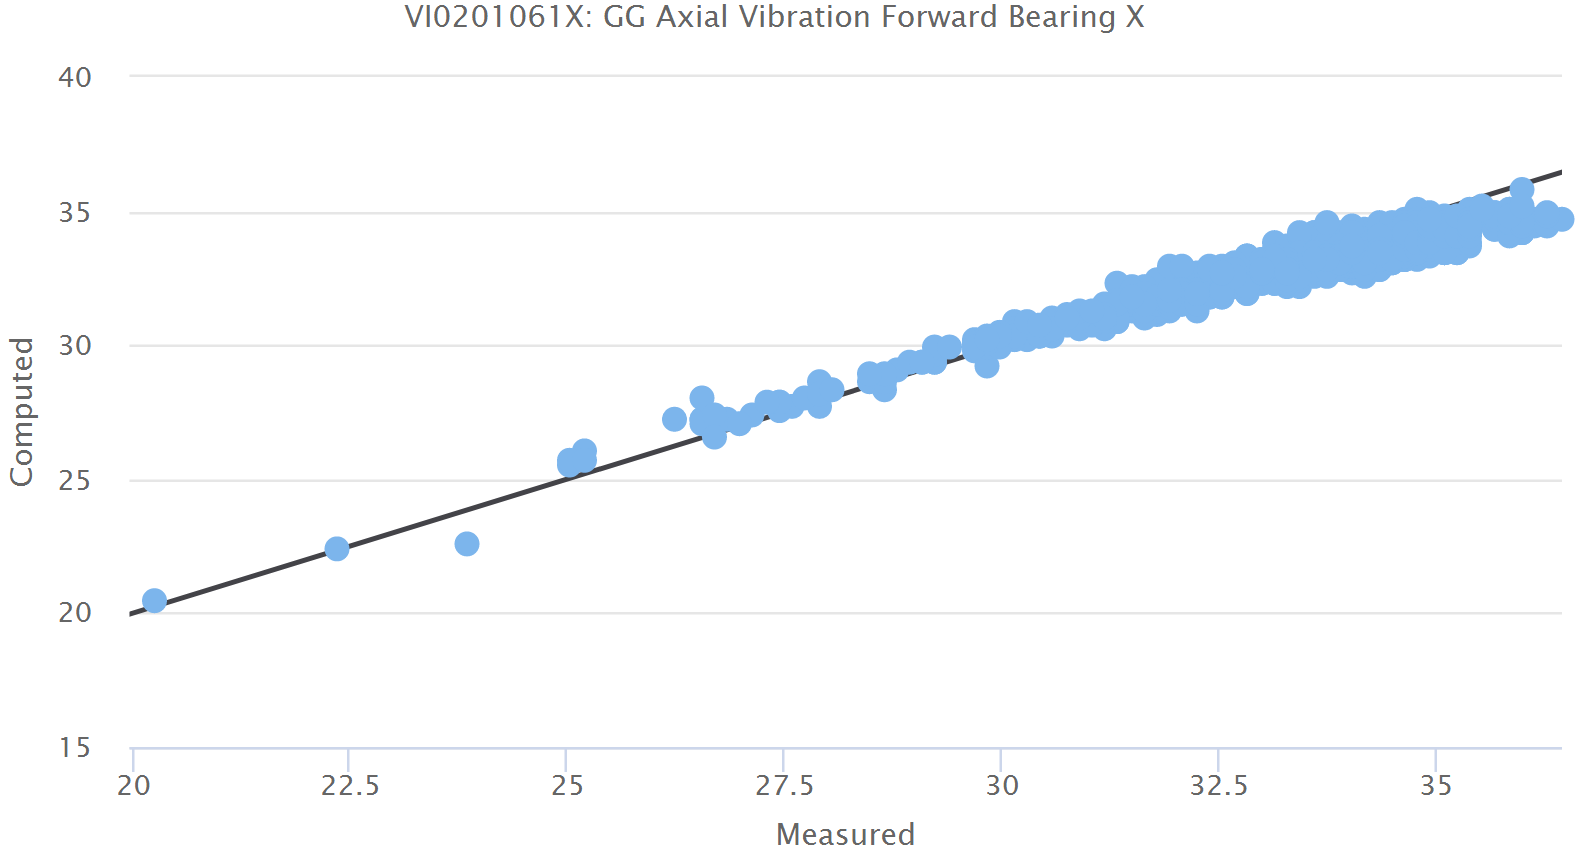
In general we expect the difference between model and measurement to be very small for the training and validation datasets as both are known healthy conditions for the equipment. If we plot the model against the measurement, we would expect to receive a straight line at 45 degrees to both axes. This plot is produced in the interface with a black line drawn at 45 degrees so that we can judge the deviation from the ideal case.
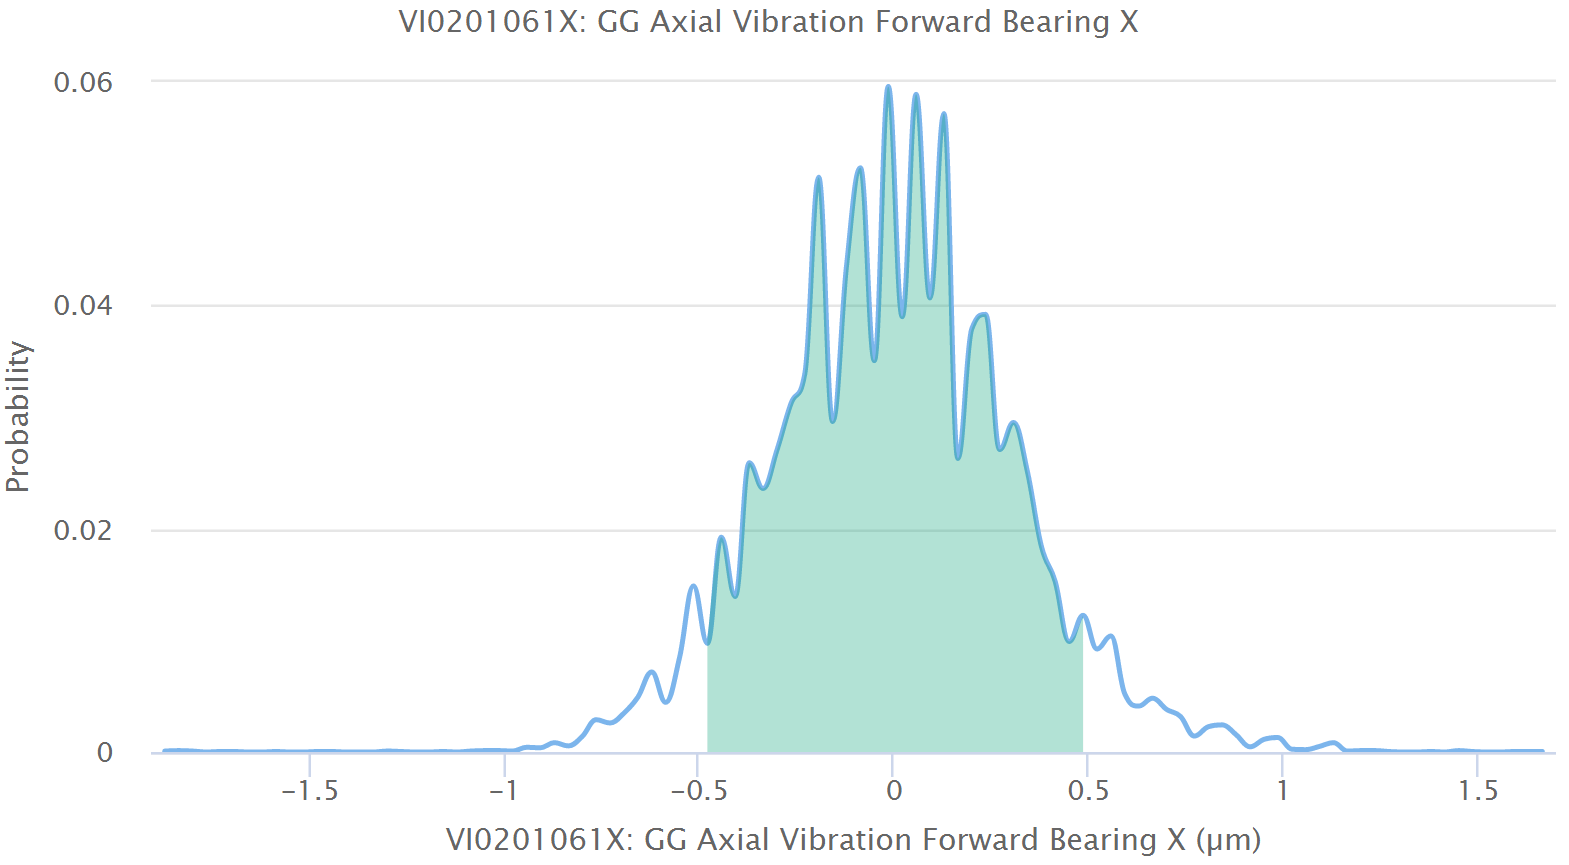
In addition, we expect the deviations between model and measurement to be such that most of them are very small and decreasing amounts are larger and larger. If we plot this deviation on the horizontal axis and the proportion of points that have that deviation on the vertical axis, we receive a probability distribution of the deviations. This is plotted in the interface as well. We would expect this to be a bell-shaped curve, ideally a normal or Gaussian distribution. If that is the case, then this is another indication of good model quality.
We also measure statistical quantities such as mean, standard deviation, skewness and kurtosis for this probability distribution to give further details. In practice a visual inspection of these three diagrams is sufficient to judge if the model is good or not.
If the model is not good, then there are two possible reasons for this. First, the independent variables selected are not the right ones. We must either add some more or remove some disturbing ones. Usually, we have to add variables. Second, the training periods are not long enough or contain unhealthy states. Please check this carefully as the integrity of the data used to define health is the critical element in the entire analysis.