Manual: 7.2.4. Clustering
Quantitative data often can be divided into qualitative groups. Operating a gas turbine, for example, we may run it in idle, half load or full load mode. These concepts mean something to a human engineer who understands them. They can be defined for the computer using strict rules based on measurements such as the rotation rate. However, creating such rules brings several problems with it: (1) The rules will necessarily have to be strict and simplistic, (2) a human engineer has to take the time to define them, (3) the rules must be maintained in some system and periodically checked for accuracy as the equipment or plant gets modified over its lifetime, (4) data entry is error prone if we consider the volume of such definitions that are necessary for an industrial plant operating hundreds of such pieces of equipment with hundreds or thousands of measurements each.
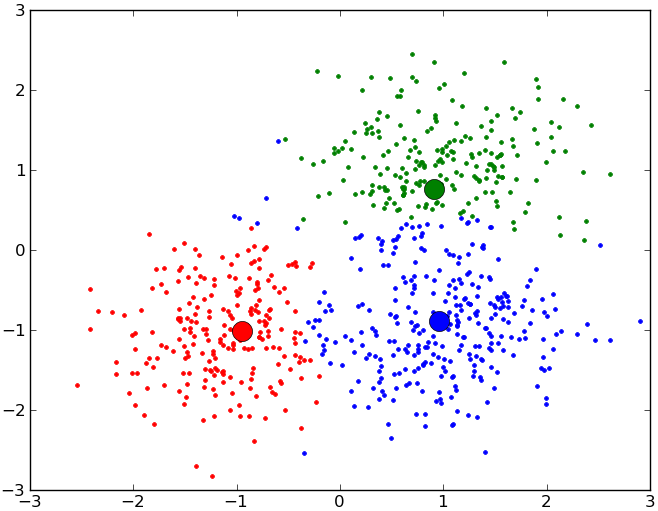
All these issues can be resolved if we group operational points together based on data analysis rather than rules generated from human understanding. The attempt to do this is called clustering. In it, we try to determine the number of clusters and their membership over a historical collection of observations subject to two conditions: (1) There should be little variability between the members of any one cluster and (2) there should be a lot of variability between members of two different clusters.

When we deal with quantitative data, we can define a cluster to essentially be a sphere. That is to say a cluster is a point in space with a certain radius. Every historical observation inside this sphere belongs to this cluster and every point outside does not. Clearly, this approach will have to deal with overlapping spheres and with some points that do not fit into any sphere. Nonetheless, this idea is the most popular in clustering.
In practice we thus ask ourselves how many spheres we need, where they are and how big they are in order to satisfy our two criteria. There are methods to do this and will result in a good clustering of any dataset. Unfortunately, these methods are expensive in terms of computation time but they can realistically be applied to industrial grade data.
The benefit of these methods is that they allow an automated event framework to be defined. As the equipment performs its function, we can then easily tell in which condition or event the equipment currently operates. Each time that the equipment changes its condition or event, this fact can be recorded. Both of these features combined can be used to drive a calculator for equivalent operating hours for the equipment as transitioning from one state to another may be quick in clock time but consume far more in terms of equipment lifetime.