Manual: 7.2.5. Variable Reduction
Much of the data that is stored in a typical data historian in an industrial plant is not needed in order to make reliable statements about equipment health or process optimization. Usually less than 10% of all measurements are actually needed. Of these, there is generally substantial duplication of information in the data.
Whenever we want to model a system, the first task is to intelligently select the necessary data. There is a danger in giving the analysis not enough data and so we usually err on the side of caution and include a number of measurements of which we are not sure whether they add information or not. To avoid unnecessarily cluttering the analysis with superfluous data, we must determine which measurements are actually important and which are not.
On top of that, some measurements are correlated with each other and so add some information but not as much as others. Take for example your own body weight, height, sex and level of physical activity. Based on your height, sex, and level of physical activity one cannot know your weight but one can make a reasonable statistical guess at your weight. Measuring your weight after this estimation provides additional information but not as much as the original three values provided because your weight is correlated with them. Depending on what one wishes to figure out about a person, one may be able to do it without knowing this additional piece of information and make do with the original ones.
Based on these insights, we get two different ideas for reducing the number of variables in a model. We could identify variables that are not needed at all and simply exclude them from the model altogether. Secondly, we may transform the dataset into a different coordinate system with fewer dimensions in which, however, each of the new dimensions is a combination of the original dimensions. This second idea is based on the insight described above that some measurements provide a little extra information and should thus not be thrown out altogether but are not really worth a full dimension.
This idea leads to principal component analysis, which is best explained visually.
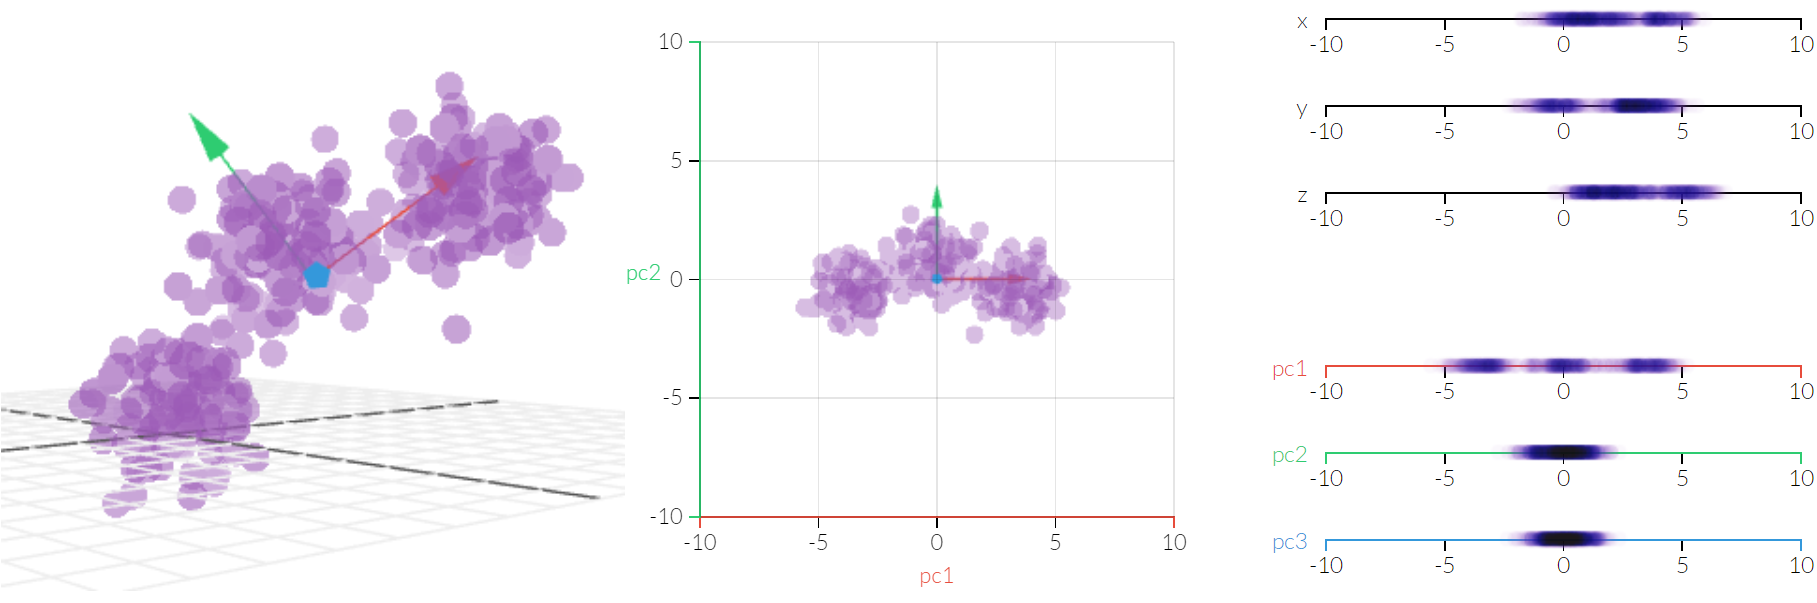
The selection of how many principal components are needed to explain the information in a dataset can be made precise using statistical information. In this case, it was clear to a human viewer that one dimension is enough to separate the three classes of data points. If we are dealing with reducing 10,000 dimensions to 500, then this will no longer be visible to a human user but can nevertheless be made precise.
We use this method to reduce the dimensionality of the dataset while maintaining the amount of information contained in it. The ultimate benefit is that we can model the dataset using significantly less parameters without sacrificing (much) accuracy. This not only saves time but also improves the generality of the model as it is a general truth in machine learning that a model with fewer parameters has greater power of generalization to data that was not learned.