Manual: 5.2. Concept of Dynamic Limits
IHM constructs a machine learning model of one measurement time-series as a function of several other such time-series coming from one industrial plant or piece of equipment. If the underlying physics and chemistry of the industrial process remains the same over the long-term, then the modeling process will be able to deliver an accurate, precise and reliable model for the measurement concerned.
This model is constructed over a time period where the equipment is known to have been healthy. Therefore the model becomes the definition of health for the tag being modeled instead of the static limits in normal condition monitoring.
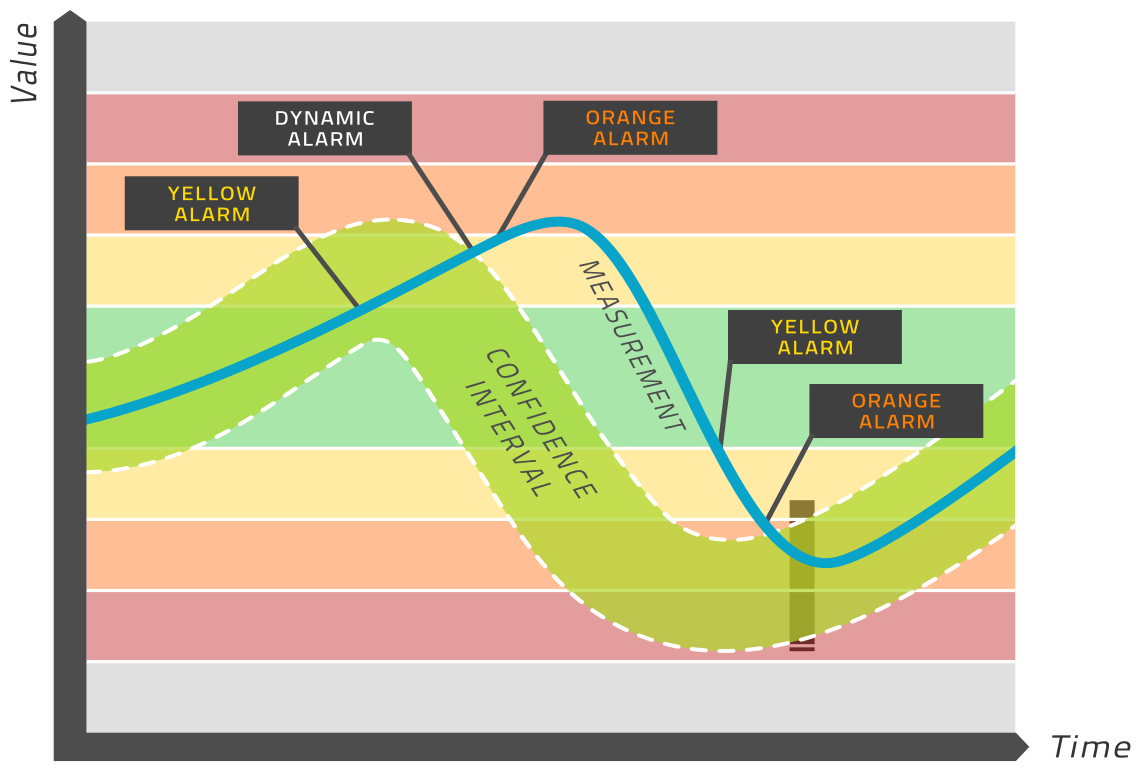
The model is evaluated in real-time and yields an expected value for each relevant tag. A confidence interval is computed around this expected value, which amounts to a range of values (light green band in the above picture) that are considered healthy. If the measured value lies within this band, then the equipment is healthy. If the measured value is outside this band, then an alarm is released. This is in sharp contrast to normal condition monitoring, where alarms are released based on limiting values that do not change over time, such as the normal yellow, orange, red regions that one can define in many condition monitoring tools. This is why we refer to this approach as dynamic limits. Please see the image above for a visual depiction of this process.
If you are interested in the model itself and how it is obtained, please see below in the section on mathematical background.