Manual: 5.3. Concepts of IHM
Machine learning methods take empirical data that has been measured on this particular machine in the past when it was known to be healthy. From these data, the machine learning methods automatically and without human effort construct a mathematical representation of the relationships of all the parameters around the machine.
It can be proven mathematically that a neural network is capable of representing a complex data set with great accuracy as long as the network is large enough and the data consistently obeys the same laws. As the machine obeys the laws of nature, this assumption is easily true. We therefore use a neural network as the template for modeling each measurement on the machine in terms of the others. The machine learning algorithm finds the values for the model parameters such that the neural networks represent the data very accurately.
The selection of which measurements are important to take into consideration when modeling a particular measurement can also be done automatically. We use a combination of correlation modeling and principal component analysis to do this.
The result is that each tag on the machine gets a formula that can compute the expected value for this tag. As the formula was trained on data known to be healthy, this formula is the definition of health for this machine. Unhealthy conditions are then considered deviations from health.
It is important to model health and look for deviations from it because health is the normal condition and much data is available for normal healthy behavior. Rather little data is available for known unhealthy behavior and this small amount is very diverse because of a host of different failure modes. Failure modes differ for each make and model of a machine making a full characterization of possible faults very complex. Modeling poor health is not a problem of data analysis but rather data availability. As such, this problem is fundamental and cannot be tackled in a practical and comprehensive way.
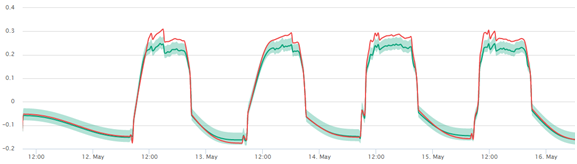
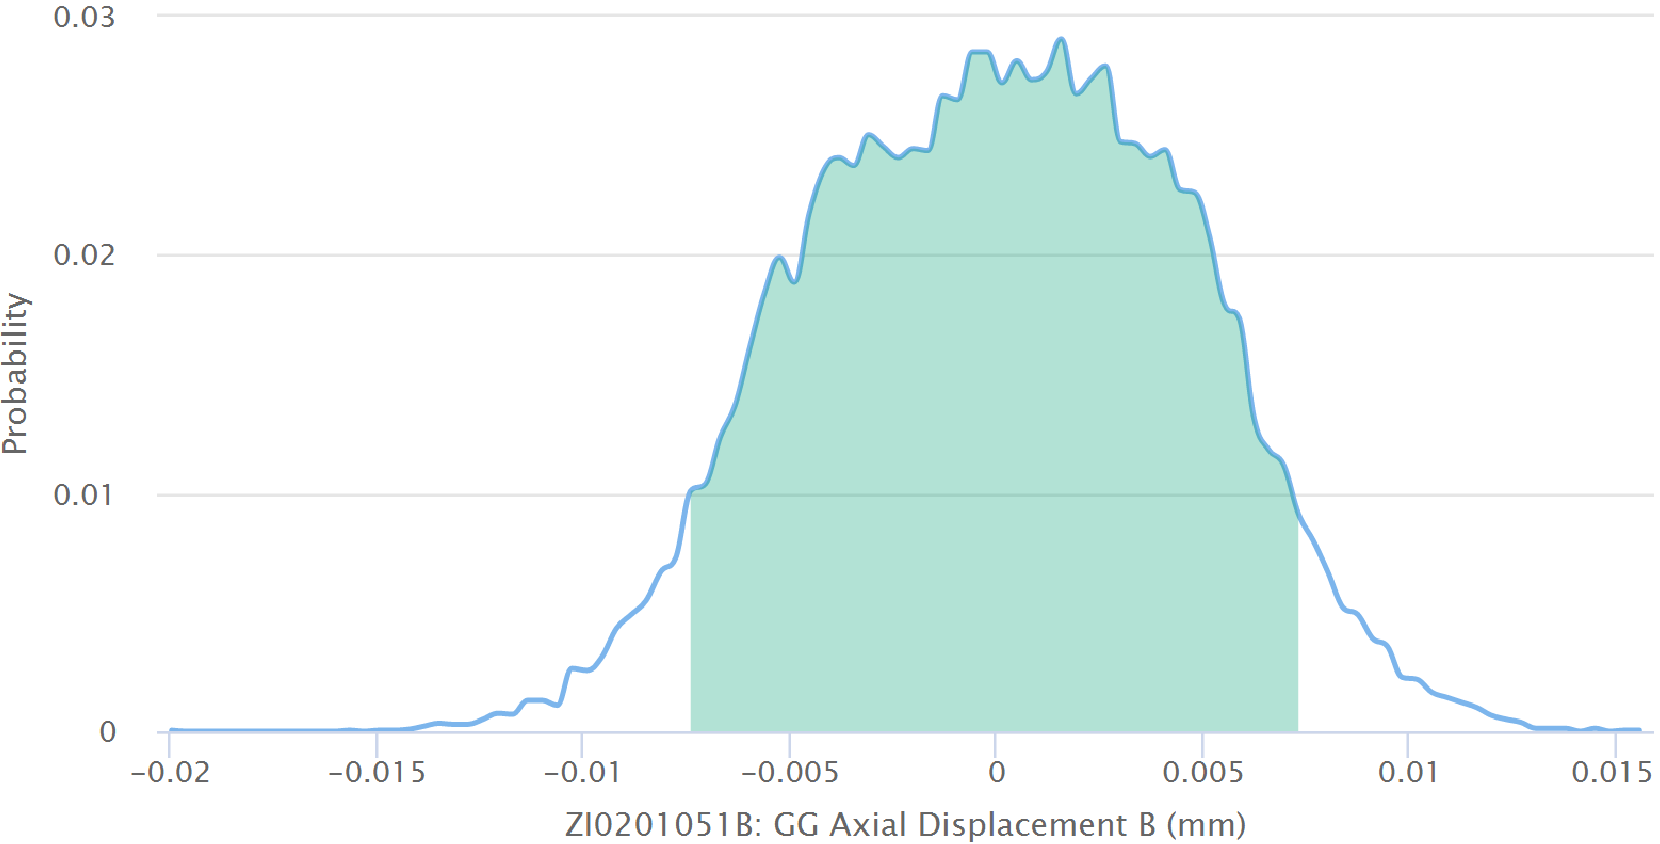
At any one time, we can compare the expected healthy value to the sensor value. As the expected value is computed from a model, we know the probability distribution of deviations, i.e. how likely is it that the measurement will be away from the expectation by a certain amount. So we may compute the probability of health from this distribution or conversely use this confidence interval in order to judge if the sensor value is too far away from health. If that is found to be the case, then an alarm is sent.
The alarm can be enriched by the information of how unhealthy the state is by providing the probability of poor health. Since the expected value has been computed from a (usually small) number of other machine parameters, it is generally possible to lay blame on some other measurement. This gives assistance to the human engineer receiving the alarm in the effort to diagnose the problem and design some action.
With normal condition monitoring, in practice, it is often found that when a machine transits from one stable state to another, lots of (false) alarms are released because a simple analysis approach cannot keep up with the quickly changing conditions. As a neural network can easily represent highly non-linear relationships, even a startup or load change of a machine will be modeled accurately without alarm if everything is as it should be.